FREE Federal Spending Data Could Help Earn Investors Millions
Photo by Anna Nekrashevich from Pexels
no-cost government-sponsored DATA reveals softer growth in key U.S. sectors
Over the past several years, one of the backbones of the U.S. Federal Statistical System, the Bureau of Economic Analysis, or BEA, has been quietly stepping into the world of real-time consumer spending data. Real-time spending data has traditionally been produced by private companies who pay for and collect daily or weekly payment card transactions. The market is roughly $10 billion globally. Those close to the industry say actual payment turnover is probably much higher.
Typically, real-time spending data is not cheap. Quotes vary widely. But access to a quality information cost researchers and investors roughly $500,000 per year.
The steep price for real-time data is about to vanish: About 14 months ago, the BEA struck a deal with financial information provider Fiserv (FISV). The BEA began to publish weekly live consumer payment-card spending information. The data appeared right along the BEA’s bedrock information sets, such as quarterly survey-driven gross domestic product figures and regional economic information.
From the beginning, the BEA has been careful to limit speculation on what its new real-time data revealed. Just a few months of history can’t possibly offer true long-term context. The classifications the BEA developed were based on established real-world conventions. Classifications such as “Ambulatory Healthcare Services” sound interesting. But how important are they, compared to “Non-store retail” sales which can – or cannot – include internet spending?
The Bureau’s economists were always clear that any conclusion from its real-time data needed to be confirmed with established data narratives.
Covid Reinvents the Real-Time Data Story
Then the pandemic struck. Overnight, Covid-19 changed the stories the BEA’s real-time spending data could tell. Established data sets struggled with the dramatic statistical swings in pandemic-altered output and growth information. The newness of BEA’s real-time information emerged as reliable a data source as any. Web giants such as Amazon and Zoom made their data public and transparent. Little extra information was needed. What truly challenged markets and analysts was the prospects for old-world brick and mortar businesses. That is the exact real-time data the BEA has been collecting.
Starting last year, the BEA rebranded its real-time spending information as Covid-related estimates of payment card transactions. It began updating the data weekly and using it to create solid research.
A statistical star was born: The BEA’s real-time spending data became indispensable for economic modelers and investors.
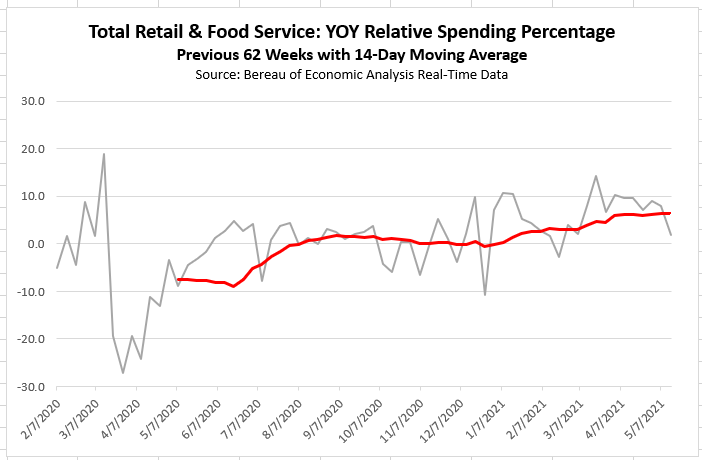
In fact, relative year-over-year spending has been stuck in single-digits since January 2021. Even now, well in to May 2021, the increase in year-over-year spending is still about 8%.
BEA growth-rate data confirmed just how low growth the American economy currently is. Growth was brisk in some months during the post-pandemic period. But it dropped into negative rates in others. The combination of these ups and downs yielded an overall flat trend in increases in sales.
The main conclusion: Growth in consumer spending has been stubbornly stuck at zero throughout the pandemic.
Covid Growth Is a Sector Thing
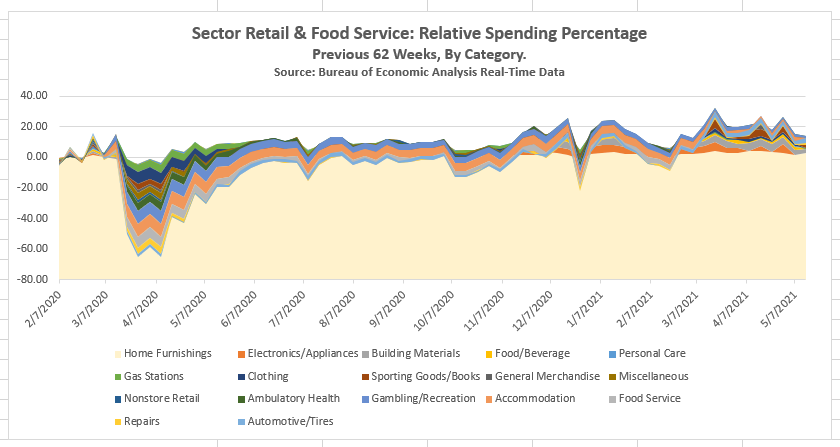
BEA real-time data expresses just how variable the post-pandemic recovery can be. For example, gas station sales did not crater as deeply as food services back in March 2020. But, by March 2021, gas station rolled back deeply.
Gas stations sales lagged behind other categories, like food services.
Since retail store fuel turnover is a reliable leading business indicator as any, flat growth in gas sales implies that the overall growth in transportation in the post-pandemic economy might just be softer than expected.
Much is to be revealed with the BEA’s real time data sources. And to date, the data indicates the recovery might just much more modest than regulators and market participants guessed.


